
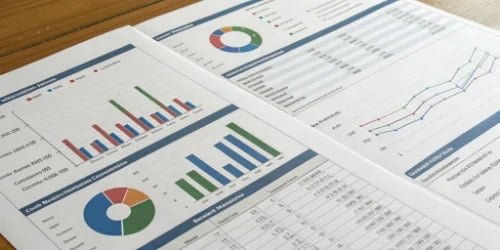
Struggling to see the full picture of your slaughterhouse's performance? Without the right data, you are flying blind and leaving money on the table. A comprehensive report is your cockpit view.
A comprehensive slaughterhouse indicator report tracks key metrics like daily slaughter volume, average weight, carcass grade, cut-up rate, by-product rate, loss rate, cost per head, and gross margin. These indicators provide a complete overview of operational efficiency and financial health in one place.
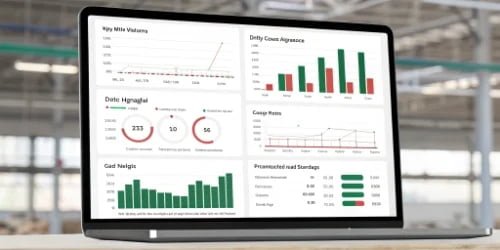
You now have a list of the core metrics. But knowing what to track is only the first step. The real power comes from understanding how these numbers connect and what they tell you about the health of your business. As a provider of weighing solutions for the past 19 years, I've seen firsthand how a deep dive into these numbers can transform an operation. Let's break down how to effectively track, measure, and use these indicators to drive real growth and profitability in your slaughterhouse.
What Are the Core Metrics Included in a Comprehensive Slaughterhouse Indicator Table?
You know you need data, but the sheer amount can be overwhelming. Focusing on vanity metrics wastes time, while the right indicators provide a clear path to improving efficiency and profit.
A comprehensive table includes metrics covering the entire process, from intake to sales. It integrates production data (volume, weight, yield) and financial data (cost per head, margins) to provide a holistic view. This allows for quick analysis of operational health.
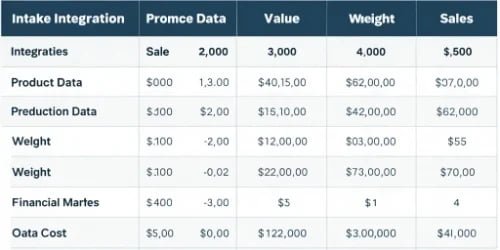
To truly manage your slaughterhouse, you need to organize these metrics in a way that makes sense. At Weigherps, we help our clients categorize them into two main groups: Production and Financial. This separation helps managers quickly identify if a problem stems from the operational floor or from a cost/pricing issue. This structure is the foundation of effective, data-driven management.
Production Metrics
These indicators measure the physical efficiency of your operation. They tell you how effectively you are converting live animals into sellable products.
| Metric | Description | What It Tells You |
|---|---|---|
| Daily Slaughter Volume | The total number of animals processed per day. | Your plant's throughput and capacity utilization. |
| Average Weight | The average live weight and carcass weight per animal. | The quality of incoming livestock and initial yield potential. |
| Carcass Grade | The distribution of carcasses by quality grade (e.g., Prime, Choice). | The value of your primary product before further processing. |
| Cut-up Rate / Yield | The weight of primal cuts as a percentage of carcass weight. | The efficiency of your butchering process and staff skills. |
| By-product Rate | The weight of sellable by-products (organs, hides) as a percentage. | How well you are maximizing value from every part of the animal. |
| Loss Rate | The percentage of weight lost due to trimming, waste, or errors. | Areas of inefficiency and potential for cost savings. |
Financial Metrics
These indicators measure the profitability of your operation. They connect your production efficiency directly to your bottom line.
| Metric | Description | What It Tells You |
|---|---|---|
| Cost Per Head | Total operational costs divided by the slaughter volume. | Your overall operational cost efficiency. |
| Sales Gross Margin | The difference between revenue and the cost of goods sold. | The fundamental profitability of your products. |
How Can Slaughterhouses Track and Measure Key Performance Indicators Effectively?
Using pen and paper or clunky spreadsheets for tracking? This manual process is slow, prone to human error, and makes it nearly impossible to get real-time insights for quick decisions.
Effective tracking requires an integrated system of smart scales and software. Data is automatically captured at key points—from livestock reception to carcass rail and final product—and fed into a central dashboard for real-time analysis, eliminating errors and delays.
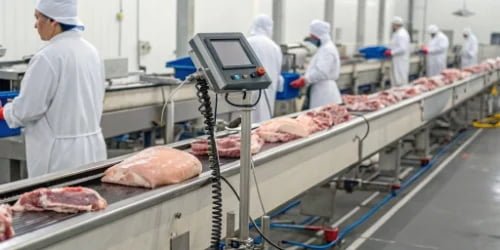
I remember a client who was convinced his team was highly efficient, but his profits didn't reflect it. They were tracking everything manually. After we installed an integrated weighing system, the data told a different story. Small, unrecorded losses at each stage added up to a significant drain on his bottom line.1 Moving from manual to automated tracking isn't just about convenience; it's about uncovering the truth of your operation.
The Old Way vs. The New Way
The difference between outdated and modern tracking methods is stark.2 The new way, which we specialize in, empowers managers with accurate, timely information.
| Aspect | The Old Way (Manual) | The New Way (Automated) |
|---|---|---|
| Data Entry | Pen & paper, manual spreadsheet input | Scanners, RFID, integrated scales |
| Accuracy | High risk of human error, rounding, and missed entries | Extremely high, objective, and consistent |
| Timeliness | Data is delayed, often reviewed weekly or monthly | Data is available in real-time on dashboards |
| Analysis | Requires manual calculation and is time-consuming | Automated reports, trend analysis, and alerts |
Key Data Collection Points
To build an effective system, you must capture data at critical stages. Each point requires a specific type of industrial weighing solution.
- Animal Reception: Livestock scales weigh animals upon arrival, setting the baseline.
- Carcass Line: Overhead rail scales weigh carcasses post-slaughter to calculate initial yield.
- Cut-up Floor: Bench and floor scales track the weight of primal cuts, by-products, and waste.
- Packaging & Dispatch: Checkweighers and platform scales record final product weights for inventory and shipping.
What Operational and Financial Metrics Are Crucial for Slaughterhouse Management?
Not all data points are created equal. Focusing on dozens of metrics can be confusing and lead to "analysis paralysis," where no action is taken because managers are overwhelmed by information.
The most crucial metrics are those that directly link operational actions to financial outcomes. These are Yield (combined Cut-up & By-product Rates), Loss Rate, and Cost Per Head. Mastering these three gives you control over 90% of your profitability.

In my 19 years of experience, I've seen that the most successful managers are not the ones who track the most metrics, but the ones who deeply understand the most critical ones. They know that a 1% improvement in yield can have a bigger impact on the bottom line than a 10% reduction in office supply costs. By focusing your attention on the metrics that truly move the needle, you can make smarter, more impactful decisions every single day.
Linking Metrics to Management Decisions
Every crucial metric should empower you to ask and answer a specific business question. This transforms data from a passive report into an active management tool.
| Crucial Metric | Why It's Crucial | Management Question It Answers |
|---|---|---|
| Cut-up Rate (Yield) | This is your primary revenue driver. A small change has a huge financial impact. | Are my butchers working efficiently? Are we using the best cutting patterns for this batch of animals? |
| Loss Rate | This represents pure, unrecoverable financial loss.3 It's money walking out the door. | Where are we losing product? Is it due to poor handling, trimming errors, or equipment issues? |
| Cost Per Head | This determines your operational efficiency and sets the floor for your pricing strategy.4 | What are my biggest cost drivers? Is it labor, energy, or supplies? Where can I cut costs without hurting quality? |
| By-product Rate | This represents a secondary, high-margin revenue stream. Many plants neglect it. | Are we capturing and properly processing all sellable by-products?5 Can we find new markets for them? |
By setting up your management reports to highlight these key numbers, you can instantly see where your attention is needed.
How Are Core Indicators Used to Improve Slaughterhouse Productivity and Profitability?
You've collected accurate data and focused on the key metrics. But if that information just sits in a report, it’s useless. The final, most important step is to take action.
Core indicators are used for comparison and benchmarking. By comparing current data against historical performance (vertical analysis) or against other shifts or suppliers (horizontal analysis), management can quickly identify anomalies, reward top performers, and pinpoint areas for immediate improvement.
This is where a system like ours, WeigherPS, really shines. We don't just provide scales; we provide the intelligence layer on top. Our software is designed to make these comparisons effortless. It automatically flags a sudden drop in yield or a spike in loss rate, sending an alert to the manager's phone. This transforms data from a historical record into a proactive tool for continuous improvement.
Using Data for Comparison
Comparison provides context. A number on its own means very little. It's only when you compare it to something else that it becomes a powerful insight.
- Vertical Comparison (Historical): This involves comparing current performance to past performance.
- Question: "Our loss rate this week is 3%. How does that compare to last week (2.5%) and last month (2.6%)?"
- Insight: A sudden increase signals a new problem that needs investigation, like a new, less-skilled employee on the trimming line or a malfunctioning piece of equipment.6
- Horizontal Comparison (Cross-Sectional): This involves comparing different groups during the same time period.
- Question: "Shift A has a cut-up rate of 78%, while Shift B is at 75%. Why?"
- Question: "Animals from Supplier X consistently yield 2% less than animals from Supplier Y, even though we pay the same price. Why?"
Turning Insights into Action
Data-driven comparisons lead directly to targeted action.
| Insight from Comparison | Potential Action |
|---|---|
| Shift B has a lower cut-up rate. | Investigate their process. Provide additional training or update their equipment. Learn best practices from Shift A. |
| Supplier X's animals have a lower yield. | Renegotiate the price with Supplier X based on an objective yield metric, or shift purchasing volume to Supplier Y. |
| Loss rate spiked after a new machine was installed. | Immediately inspect the new machine for calibration or operational issues. Review employee training on the new equipment. |
This continuous cycle of Measure -> Compare -> Act is the engine of productivity and profitability growth in a modern slaughterhouse.
Conclusion
Mastering these core metrics with the right tools is not just good practice. It's the key to transforming your slaughterhouse's efficiency, profitability, and long-term success in a competitive market.
- "Innovative Technologies Reshaping Meat Industrialization - PMC - NIH", https://pmc.ncbi.nlm.nih.gov/articles/PMC12248625/. This source provides examples of how unrecorded losses in operational processes can accumulate and impact profitability. Evidence role: case_reference; source type: research. Supports: Small, unrecorded losses at each stage added up to a significant drain on his bottom line.. Scope note: The source may not specifically focus on slaughterhouses but discusses general operational inefficiencies. ↩
- "Vision-based method for tracking meat cuts in slaughterhouses", https://pubmed.ncbi.nlm.nih.gov/23962525/. This source compares traditional and modern tracking methods, highlighting the advantages of automation in operational efficiency. Evidence role: general_support; source type: education. Supports: The difference between outdated and modern tracking methods is stark.. Scope note: The source may provide a general comparison without specific focus on slaughterhouses. ↩
- "The Psychological Impact of Slaughterhouse Employment - PMC - NIH", https://pmc.ncbi.nlm.nih.gov/articles/PMC10009492/. This source explains the concept of financial loss in operational metrics and its implications for profitability. Evidence role: definition; source type: education. Supports: This represents pure, unrecoverable financial loss.. ↩
- "Estimated Costs of Occupational Injuries and Illnesses and ... - OSHA", http://www.osha.gov/safetypays/estimator. This source discusses how cost per head is used to evaluate operational efficiency and influence pricing strategies in slaughterhouses. Evidence role: mechanism; source type: research. Supports: This determines your operational efficiency and sets the floor for your pricing strategy.. ↩
- "Utilization of byproducts and waste materials from meat ... - PMC", https://pmc.ncbi.nlm.nih.gov/articles/PMC3614052/. This source highlights the importance of by-product management in maximizing revenue streams in slaughterhouses. Evidence role: mechanism; source type: research. Supports: Are we capturing and properly processing all sellable by-products?. ↩
- "Effect of stress during slaughter on carcass characteristics and meat ...", https://pmc.ncbi.nlm.nih.gov/articles/PMC7463084/. This source discusses how sudden changes in operational metrics can indicate underlying issues, such as equipment malfunctions or skill gaps. Evidence role: mechanism; source type: research. Supports: A sudden increase signals a new problem that needs investigation, like a new, less-skilled employee on the trimming line or a malfunctioning piece of equipment.. ↩



Comments (0)