
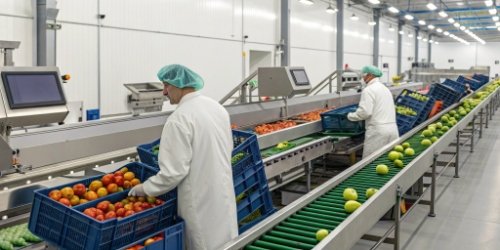
Sorting fresh produce blindly causes delays and missed deadlines. This chaos hurts your business. A real-time data projection solution puts you back in control of your entire operation.
You can control fresh sorting progress in real-time by using a data projection system. This solution visualizes key metrics like completed orders, category progress, and individual worker performance on a large screen. This allows managers to monitor the entire process from a central control room.
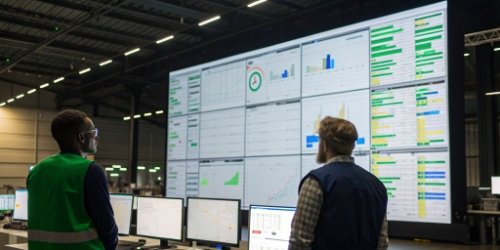
Having a high-level view is a game-changer. It turns a chaotic warehouse into an organized, efficient operation. But what exactly are the benefits you can expect? And how does this technology truly impact your daily management tasks? Let's dive into the specifics and see how this visual approach can transform your fresh produce sorting.
What Are the Benefits of Using Data Display Systems for Sorting Progress Tracking?
Relying on manual reports for sorting progress is slow and prone to error. This inefficiency costs you time and money. Data display systems offer instant, accurate insights for better management.
The main benefits include enhanced management efficiency through real-time visualization, which replaces "blind control." It also improves resource allocation by identifying bottlenecks quickly and boosts team morale by providing clear performance metrics. This leads to faster order fulfillment and fewer errors.
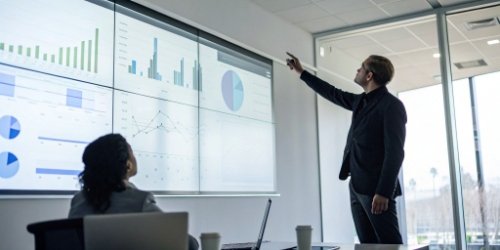
The benefits of a data display system go far beyond just showing numbers on a screen. It fundamentally changes how you manage your operations. I remember visiting a client's distribution center before they adopted our system. The floor manager was constantly running around with a clipboard, trying to get updates from team leaders. It was chaotic. After we installed the data projection solution, the same manager could sit in his office and see everything at a glance. This shift moves you from reactive problem-solving to proactive management. You can spot potential delays before they become critical issues. It creates a transparent environment where everyone knows the goals and their contribution to success.
Key Benefits Breakdown
| Benefit Category | Description | Impact on Business |
|---|---|---|
| Operational Transparency | All key metrics like order status and worker productivity are visible to the entire team and management. | Fosters accountability and a shared sense of purpose, reducing communication gaps. |
| Efficiency Boost | Instantly identify slow-moving tasks, delayed batches, or underperforming sorting stations. | Allows for immediate reallocation of resources to clear bottlenecks and maintain workflow. |
| Data-Driven Decisions | Use historical and real-time data to optimize workflows, set realistic targets, and plan for peaks. | Reduces guesswork in management and improves long-term strategic planning for growth. |
How Can Real-Time Data Projection Help Manage Fresh Sorting Efficiency?
Managing sorting efficiency feels impossible without clear data. Bottlenecks and slow performance can go unnoticed, hurting your deadlines. Real-time data projection makes these inefficiencies obvious and easy to manage.
Real-time data projection helps by providing live feedback on sorting speed, order completion rates, and individual performance. Managers can instantly see which product lines or workers are falling behind. This allows for quick intervention, like reassigning staff or addressing equipment issues, to maintain optimal workflow.
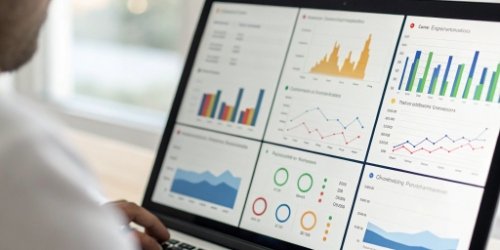
Managing fresh sorting efficiency with real-time data is all about speed and precision. In a fast-paced environment, a delay of just 30 minutes can have a ripple effect on your entire delivery schedule. Our WeigherPS system is designed to prevent this. For example, the screen can display each sorter's task list and their completion rate against a target. If a worker is falling behind, the manager sees it immediately in the control room. Is it because they have a difficult batch, or is their weighing equipment malfunctioning? Instead of finding out hours later through paper reports, you can investigate and address the root cause on the spot. This is not about micromanaging people; it is about providing support exactly when and where it is needed to keep the operation running smoothly. It's the difference between steering a ship with a modern GPS versus navigating with an old map and compass.
From Reactive to Proactive Management
| Management Aspect | Without Real-Time Data | With Real-Time Data Projection |
|---|---|---|
| Problem Identification | Discovered at the end of a shift or through customer complaints. | Identified instantly via on-screen alerts and color-coded status indicators. |
| Resource Allocation | Based on static plans or assumptions from the previous day's performance. | Dynamic; staff can be moved to bottlenecks in real time to balance the workload1. |
| Performance Feedback | Given weekly or daily, often too late to correct issues on the floor. | Continuous and immediate, allowing for on-the-spot coaching and support. |
What Digital Solutions Enable Live Oversight of Fresh Product Sorting Status?
Basic management software often lacks real-time visualization. You're left guessing or juggling multiple programs that don't communicate. An integrated weighing management system offers a unified, live view.
Digital solutions enabling live oversight typically combine IoT-enabled weighing scales with a central management software platform. Our WeigherPS system is a prime example. It captures data directly from the sorting scales and instantly transmits it to a dashboard that can be projected onto large screens.
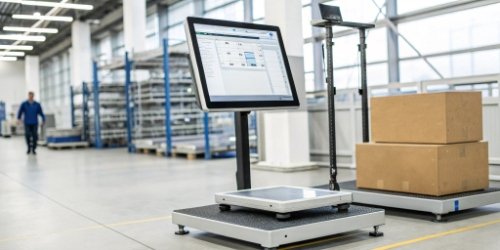
The magic behind live oversight is not just one piece of technology; it is a fully integrated system. At Weigherps, we have spent 19 years perfecting this ecosystem for clients who need reliable and accurate data. As a software vendor, you understand the importance of seamless integration. It all starts at the source of the data.
The Core Components of a Live Oversight System
Our solution is built on three pillars. First, you have the IoT-enabled industrial scales2. These are not just for weighing. Each scale is a smart data-capture point. It records weight, product type, sorter ID, and timestamps, then sends this information to the network wirelessly and securely. Second, there is the central management software. This is the brain of the operation. It receives data from all scales, processes it, and organizes it into meaningful visualizations and reports. Third, you have the data projection interface3. This output module makes the processed data visible to everyone, displaying the customized dashboard on large screens in the warehouse or control room. These three parts must work together flawlessly to give you a true, up-to-the-second picture of your sorting status.
Conclusion
In summary, data projection transforms fresh produce sorting. It moves your operation from blind guesswork to precise, visual control, boosting efficiency and empowering your team for greater success.
-
"Bottlenecks in Project Management: When One Constraint Slows ...", https://www.epicflow.com/blog/improving-multi-project-resource-management-workload-analysis-and-bottleneck-elimination-features/. Dynamic resource allocation based on real-time data has been shown to improve workflow efficiency in various industries. Evidence role: mechanism; source type: research. Supports: Real-time data enables dynamic resource allocation to address bottlenecks.. Scope note: The success of dynamic allocation depends on the accuracy and timeliness of the data provided. ↩
-
"Research on Impact of IoT on Warehouse Management - PubMed", https://pubmed.ncbi.nlm.nih.gov/36850811/. IoT-enabled scales are designed to capture and transmit data in real-time, enhancing operational efficiency in sorting processes. Evidence role: mechanism; source type: research. Supports: IoT-enabled scales enhance operational efficiency by capturing and transmitting data in real-time.. Scope note: The effectiveness of IoT scales depends on the network infrastructure and integration with other systems. ↩
-
"7. Data Visualization for Operations Insights", https://pressbooks.usnh.edu/businessopsanalytics/chapter/data-visualization-for-operations-insights/. Data projection interfaces are effective for visualizing operational metrics, improving transparency and decision-making. Evidence role: mechanism; source type: research. Supports: Data projection interfaces improve transparency and decision-making by visualizing operational metrics.. Scope note: The effectiveness of data projection interfaces may depend on the design and usability of the dashboard. ↩


Comments (0)